Mcombo 7040 Lift Chair Manual

I recently purchased an Mcombo 7040 Lift Chair for my elderly grandfather. Prior to purchasing the chair my Grandfather had some questions so I figured I would have a look at the manual for answers. Surprised that I couldn’t find one, I thought I’d share it here along with my thoughts about the chair.

Read more

Bash Scripts for Cloudinary

Cloudinary is an amazing image hosting service that offers both a highly functional free tier in addition to a paid enterprise grade image hosting and transformation service.

In this tutorial I demonstrate a few simple bash shell scripts to interface with Cloudinary.

Read more

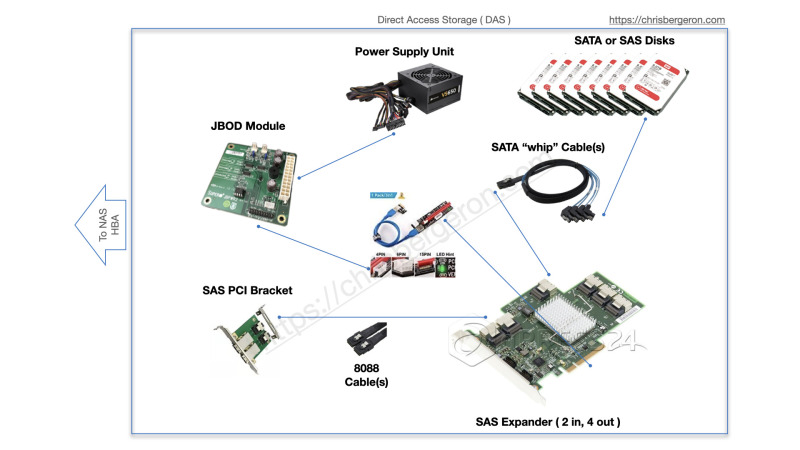
DIY DAS and NAS for Media 2020

Updated for 2021 !!!

DAS Architecture

Update: I’ve recently added a Thunderbolt 3 PCIe card for easy 40 Gbps connectivity.

Why another NAS/DAS article?

There are a lot resources online for building your own DIY DAS. A lot of them contain good information but none of them were comprehensive for the DAS I wanted to build so I compiled the information that was useful for my specific 2019 build here. The prices linked below are subject to market fluctuations and timing, so some of the components I found at a great price. Overall they should be roughly the same as what you can find. Your mileage may vary.

Read more

Cheapest Days Calendar

Are you looking for a calendar that lets you know what days of the week are cheapest to shop? If so, look no further.

Cheapest Days of the Week Calendar

I created a calendar for anyone looking to save a few dollars on common purchases. The data for this calendar comes from this Reader’s Digest post. Please check it out if you want to know the reasoning behind the timing. If you know of other days that I should add - comment below!
Read more

Deluge Grafana Dashboard

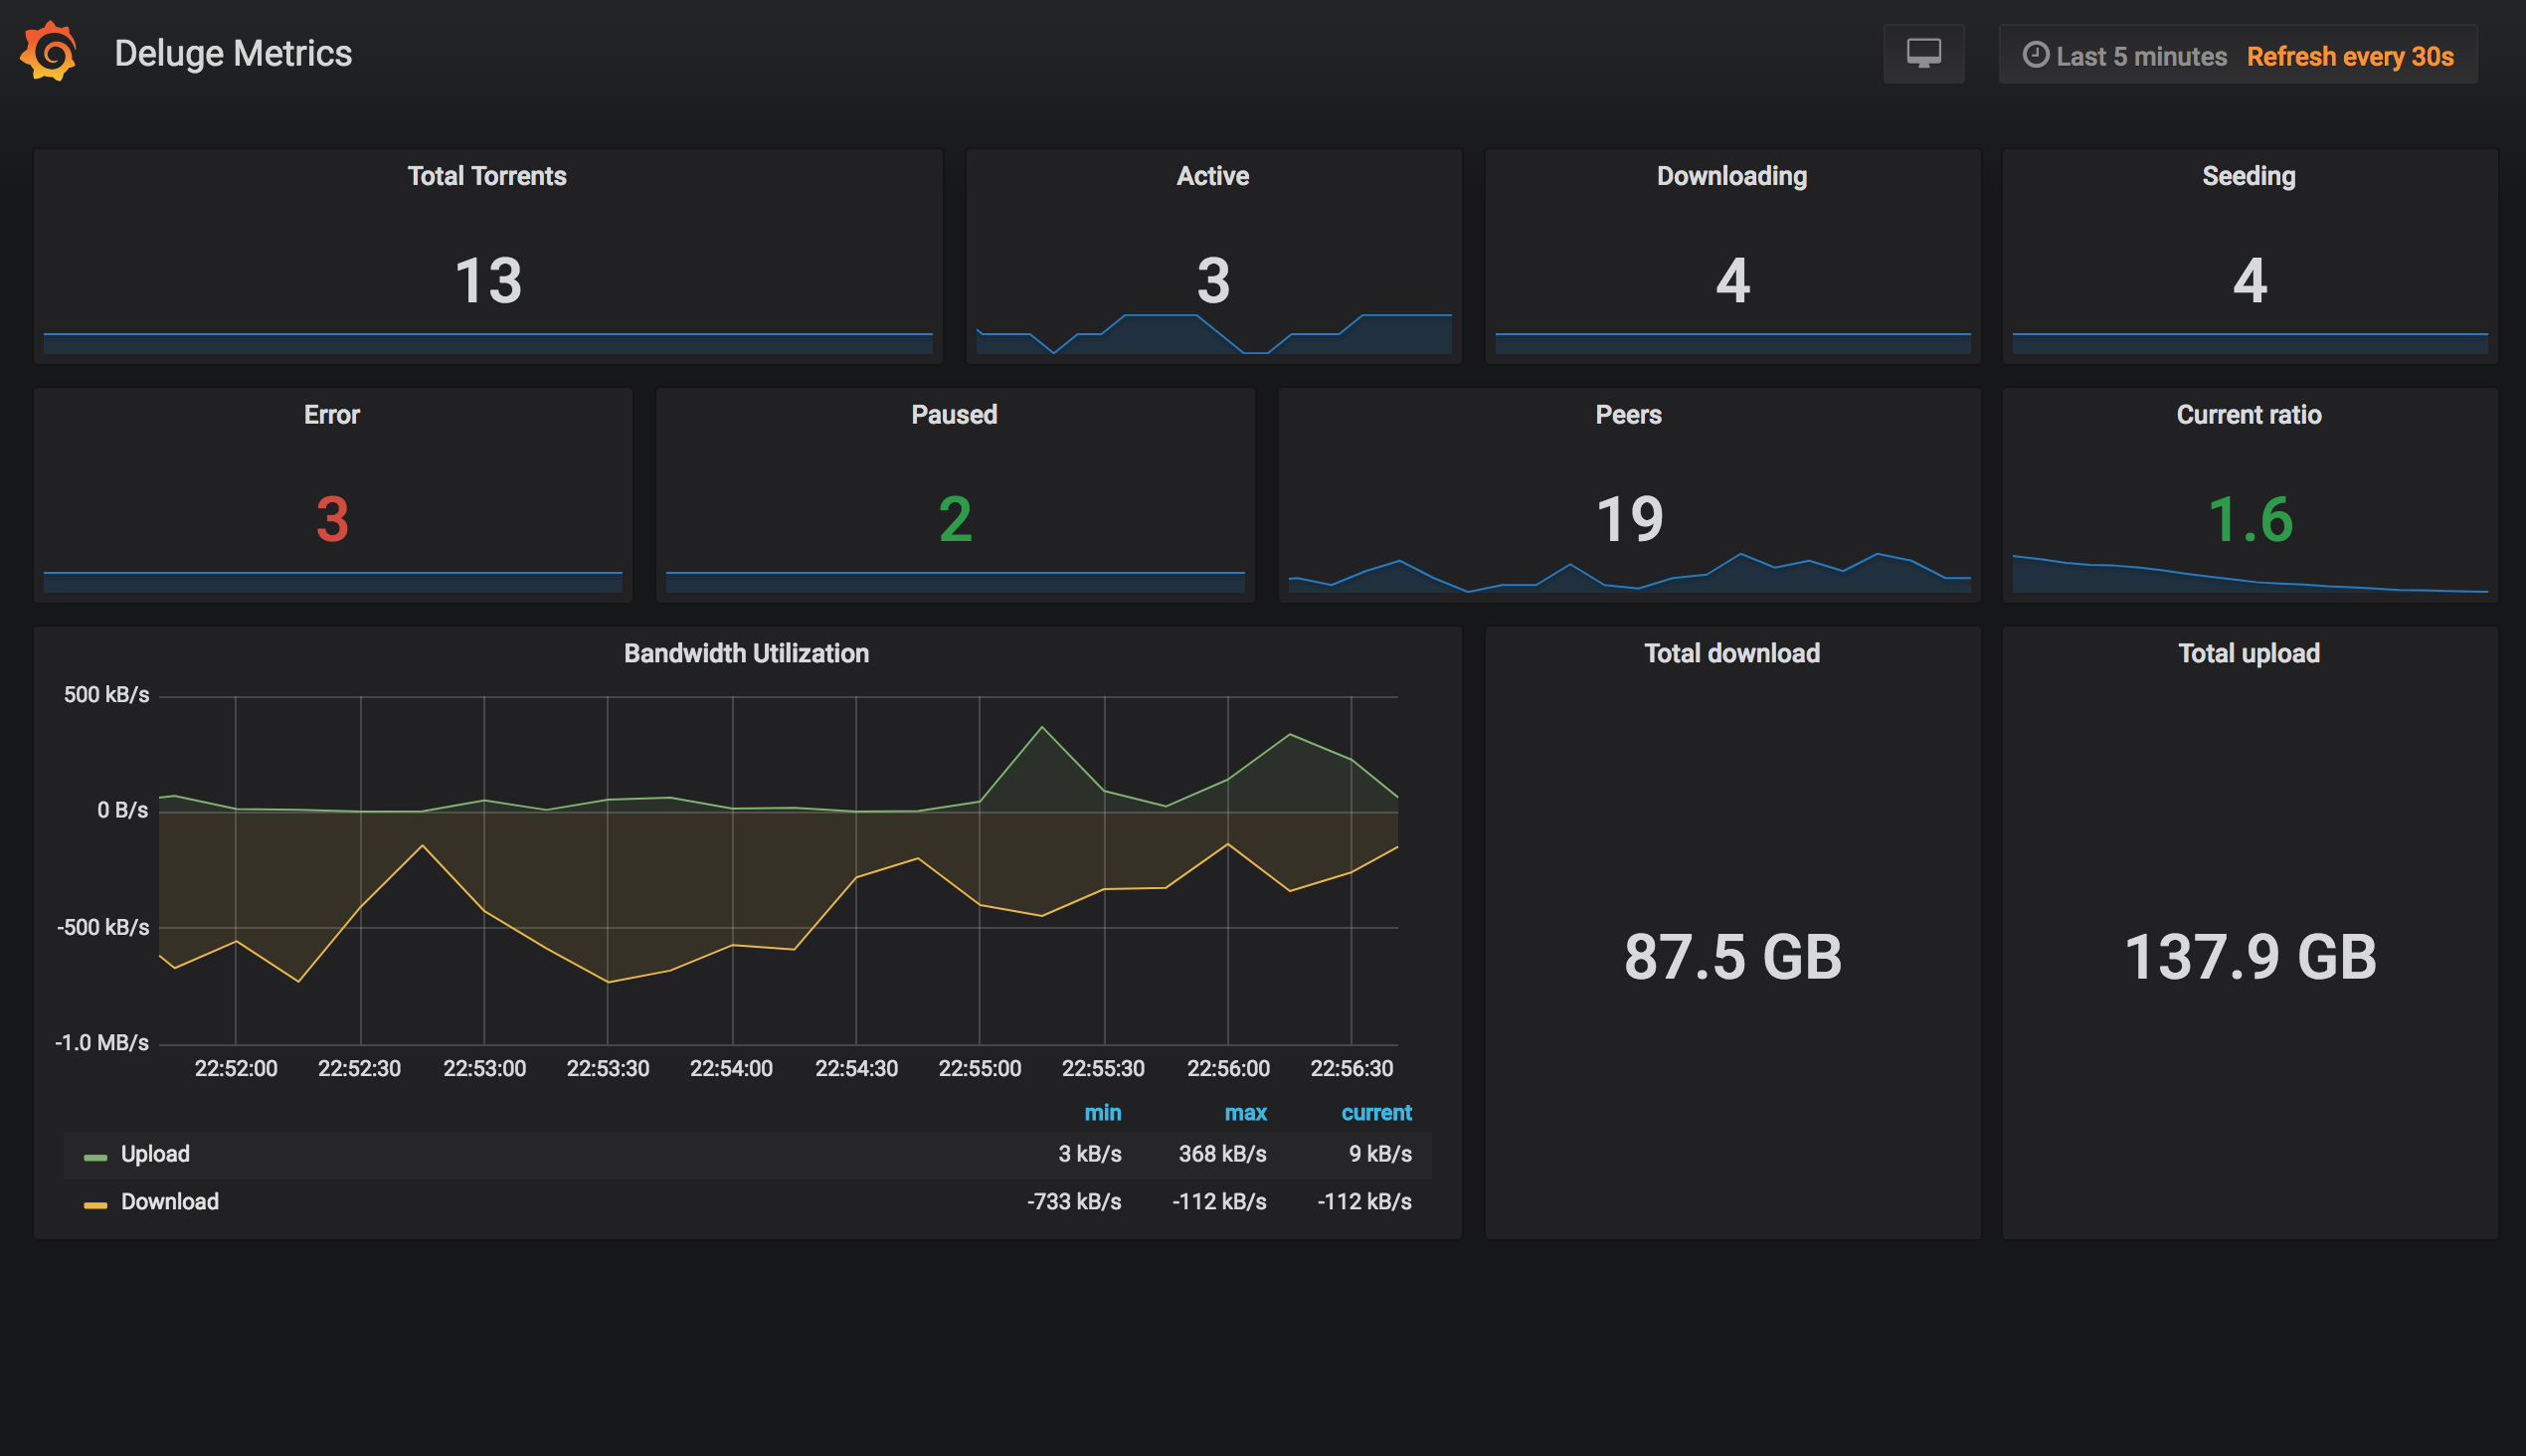
Tonight I was introduced to a Deluge exporter for Prometheus so I figured I’d whip up a quick dashboard for visualizing the metrics.

Deluge Dashboard
Deluge Dashboard is a very simple way to display Deluge torrent metrics. It uses the deluge exporter to populate a Prometheus data source. The panels in this dashboard can be copied into more comprehensive dashboards for a single pane of glass view of your network transfers or it can be used as a standalone glanceboard.

You can install the dashboard from the Grafana website or from my repo.

Read more

Easily disable Pihole from your iPhone (or iPad)


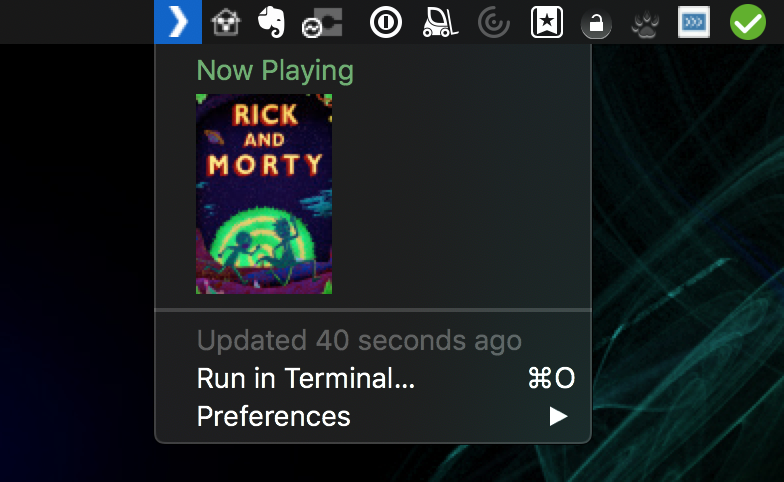
Using the Launcher Widget to disable pihole

If you run a pihole the odds are good that you’ve needed to disable it from time to time. I wanted an easy way to disable my pihole(s) temporarily, so I wrote a simple shell script to do it for me. I’m almost always on my Macbook, so this approach worked for a while. I needed to disable it a few times while I was out of the room, so I figured I’d find an easier way to do it from my phone.
Read more

Grafana Dashboards

Grafana is a really great tool for visualizing data. In my homelab, I have obviously have a lot of data so what better than to use than the right tool for the job. Below, you can find some screenshots of my dashboards. I use a raspberry pi that just runs a full screen browser for viewing the dashboard slideshow in addition to a few other glance boards (DAKBoard, Monitorr, et al).


VMWare Cluster Health Dashboard
ESXi Datastores Overview

Here’s the Gallery
Read more

Plex Grafana Dashboard

Plex Dashboard

I made a Grafana Dashboard for my Plex system at home. I feed various system telemetry into an influx database as the data source and Plex-Data-Collector for inserting the data from plex. Additionally, I wrote a python script for injecting logs from NZBGet into mysql. I then use Grafana to display the graphs. I really love Grafana and I’ve created several dashboards:

Read more