Plex Grafana Dashboard

Plex Dashboard

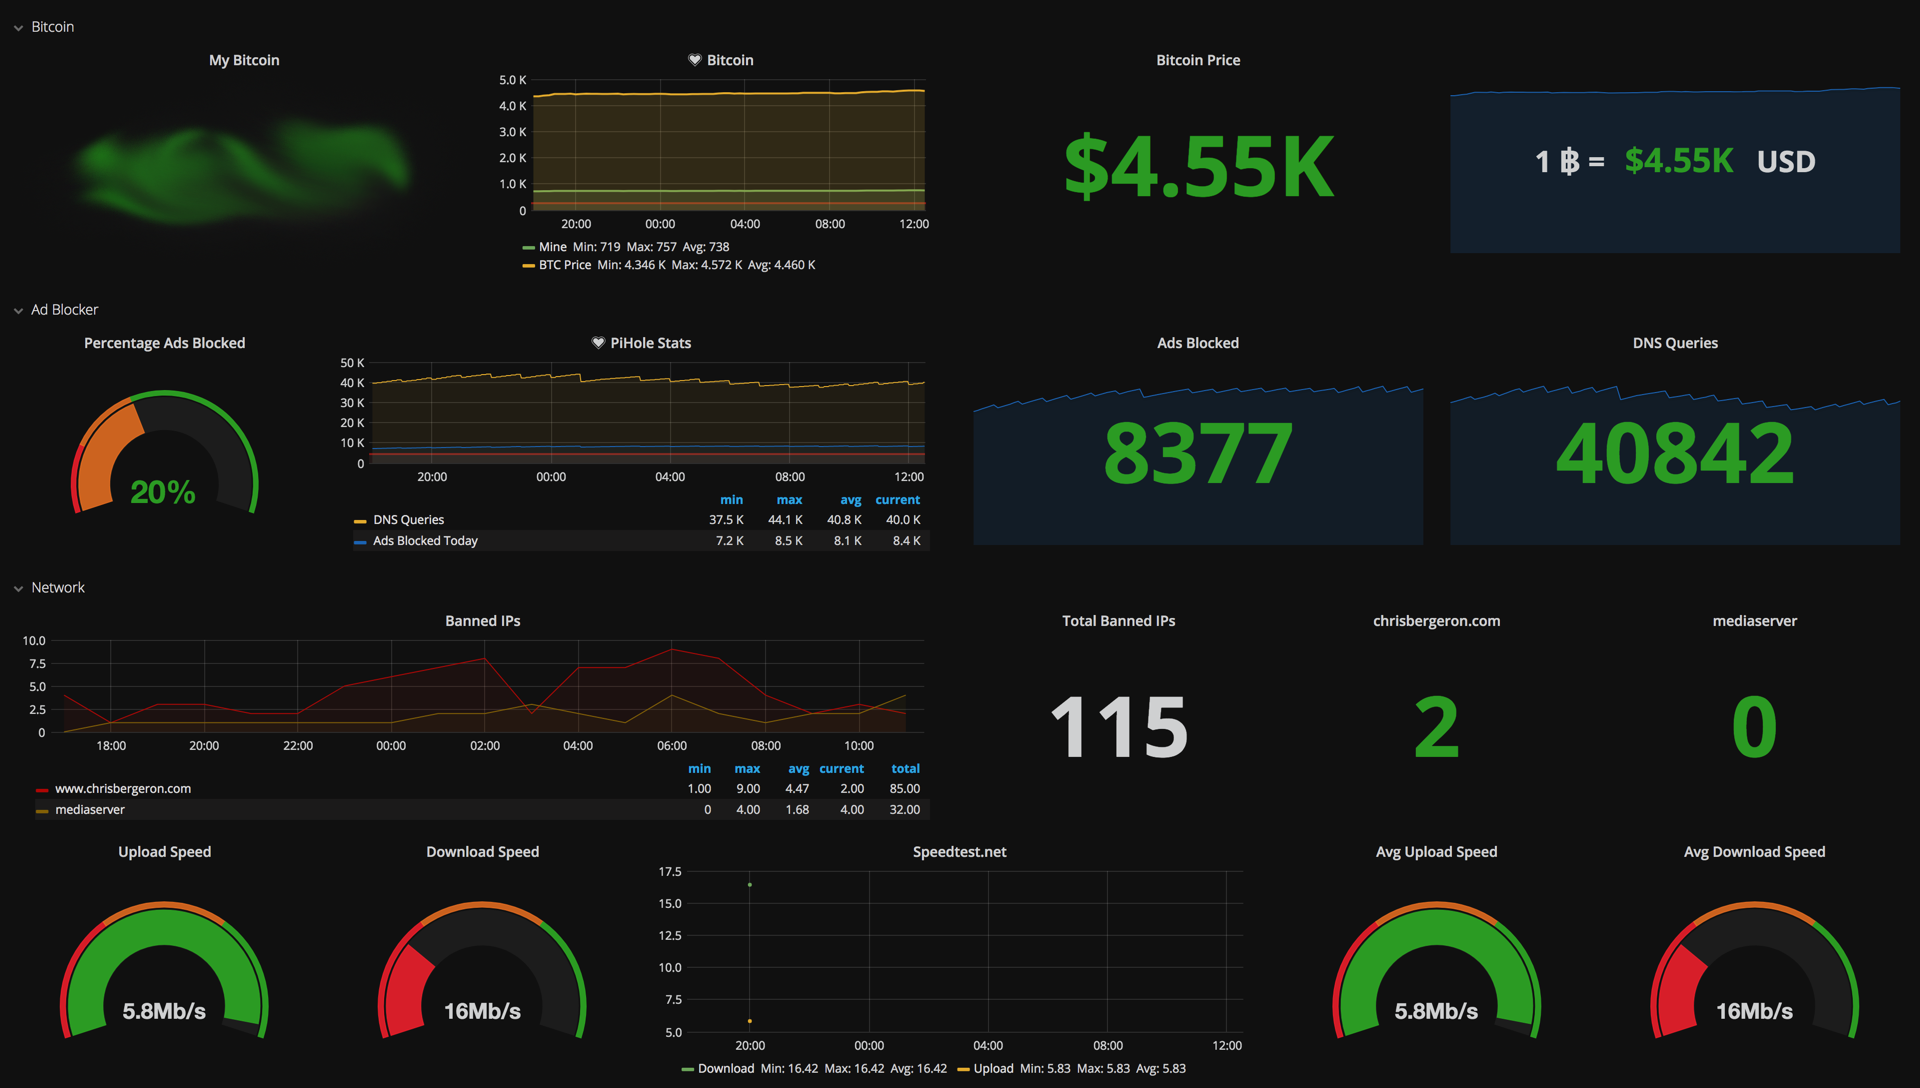
I made a Grafana Dashboard for my Plex system at home. I feed various system telemetry into an influx database as the data source and Plex-Data-Collector for inserting the data from plex. Additionally, I wrote a python script for injecting logs from NZBGet into mysql. I then use Grafana to display the graphs. I really love Grafana and I’ve created several dashboards:
Read more

pfSense graphs in Grafana

Using Grafana with pfSense

Grafana Dashboard

Update: 2018/09/13
pfSense has a plugin for telegraf which can be installed from the gui. I recommend this method rather than what I figured out below. I’m leaving these notes for manual installation reference.

2017/12/09
I put this guide together using information from various other blogs. This is current as of December 2017 and using pfSense 2.4.2. For this tutorial, you’ll need your IP or hostname of your influxdb data source and your username and password.

The data flow is as follows:

pfSense -> Telegraf (gather metrics) -> InfluxDB (store metrics) -> Grafana (render graphs)

Read more

Pfsense WAN with Cellular LTE/4G

Using pfsense for WAN Redundancy with Cellular LTE/4G

I work from home a lot and I need reliable internet connectivity to workplace. As a result, I decided to implement a failover WAN connection into my firewall. I use pfSense as my firewall which combines power and flexibility with ease of configuration.

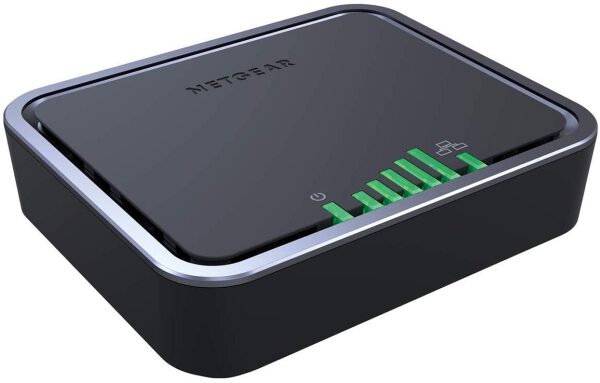
The Hardware: NetGear LB2120 LTE Modem

While researching options, I decided on the Netgear LB2120 4G LTE modem since it has Gigabit port(s) and can be used with external antennae.

Netgear LB2120

Read more

Quieting a Dell R710

I have a Dell R710 rev. II that I use in my home office lab (homelab) running ESXi 6.5. The R710 sits in my office where we work from home. Normally the hum of the R710 fans isn’t terribly bothersome - the 5 fans it houses run at around 3,800 RPM each. The noise is definitely noticeable so I did a little bit of digging into ways I could quiet it down. After looking into replacing the fans with quieter ones I found that I could override the system control of the fans and silence them that way. While I have to monitor the onboard temperatures more closely when disabled, I’ve found little downside to doing so when I’m in there. Here’s how to do it:

The commands used below assume default username / password of root / calvin. Hopefully you’ve changed the default password so substitute yours where applicable.

Read more

A Dashboard for Pihole Stats

Pihole + Grafana + InfluxDB Dashboard

Grafana Dashboard
I wanted to add the metrics from my ad-blocker, the great Pihole to my executive dashboard. To create the dashboard I used Grafana to display the graphs and InfluxDB a the time-series backend database. I use a simple python script to get the metrics from pihole and record them in influxdb.
Grafana makes it easy to render them into a user friendly dashboard.

Installing Grafana and Influxdb is beyond the scope of this blog post but here is the scipt that I use to get the data from pihole and insert it into Influx.

After you’re getting data in your influx db you’ll have to create a grafana dashboard.

Read more

Building an executive dashboard with Grafana

Grafana + InfluxDB + scripts = Awesome

I have many interests and some of them have metrics that are useful or fun to watch. For example, I have investment in Bitcoin so it’s nice to be able to keep an eye on it periodically.
I decided to create a graphical “at a glance” dashboard for myself. I chose Grafana as the user interface / front end and InfluxDB a the time-series backend database to store the metrics. I use various scripts and applets to populate the data into Influx and Grafana makes it easy to
render them into a user friendly dashboard.

Some of the metrics I monitor are Pihole stats, the price of bitcoin, how many IPs get banned from my webservers and my network throughput.

Here’s my dashboard:

Grafana Dashboard

Read more